September 2025 Clarity Updates
The latest Clarity Data Intelligence® (Clarity) updates are now available to improve your Credit Risk Transfer (CRT) experience.
Here’s what’s new:
CRT Charts – New Timeline Drop-Down
Using the new ‘Timeline’ drop-down, you can now choose to view CRT charts by ‘Months Since Issuance’ or ‘Period’:
- Months Since Issuance: View delinquency, loss mitigation or credit event data by the number of months since CRT deal issuance.
- Period: View delinquency, loss mitigation or credit event data by reporting period.
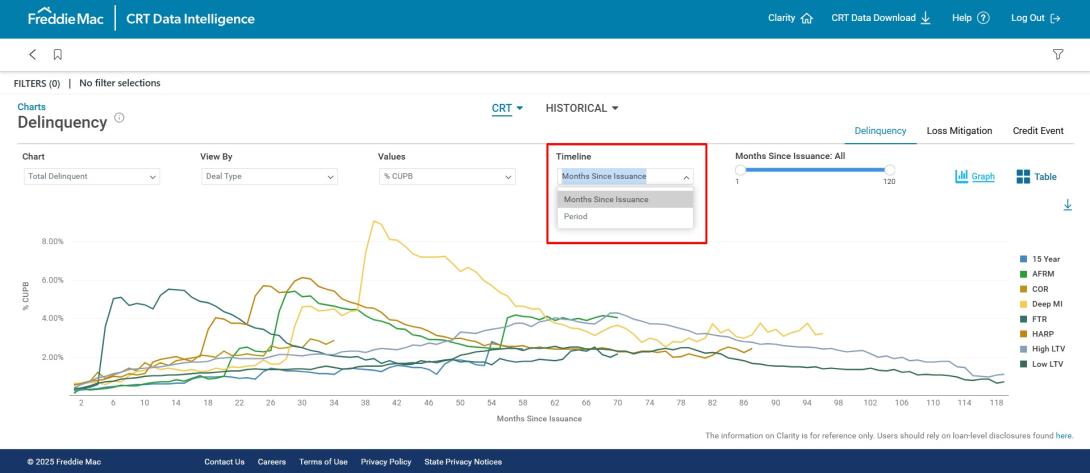
After selecting the timeline option, use the slider to filter the x-axis of the dashboard to the desired range to show how loans in various cohorts perform during the life of a CRT deal.
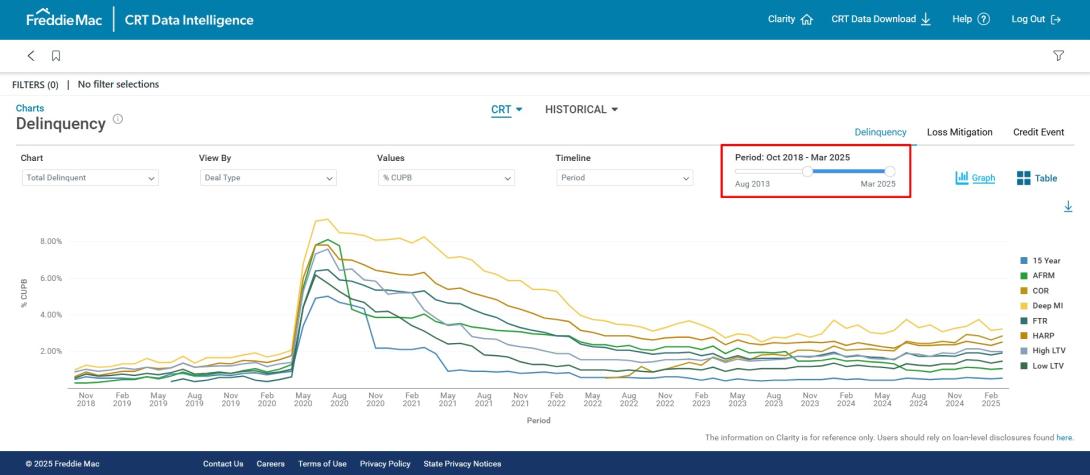
Note: When you adjust the timeline slider to filter the ‘Months Since Issuance’ or ‘Period’, it retains your selected range (even if you switch between the two views), helping ensure consistency in your data focus. To explore the full dataset and avoid unintentionally filtering out data points, reset the timeline slider when switching between menu options.
Additionally, the global filter and ‘View By’ drop-down for Property Type on all Charts dashboards now group loans into ‘Non-Manufactured Housing’ and ‘Manufactured Housing’.
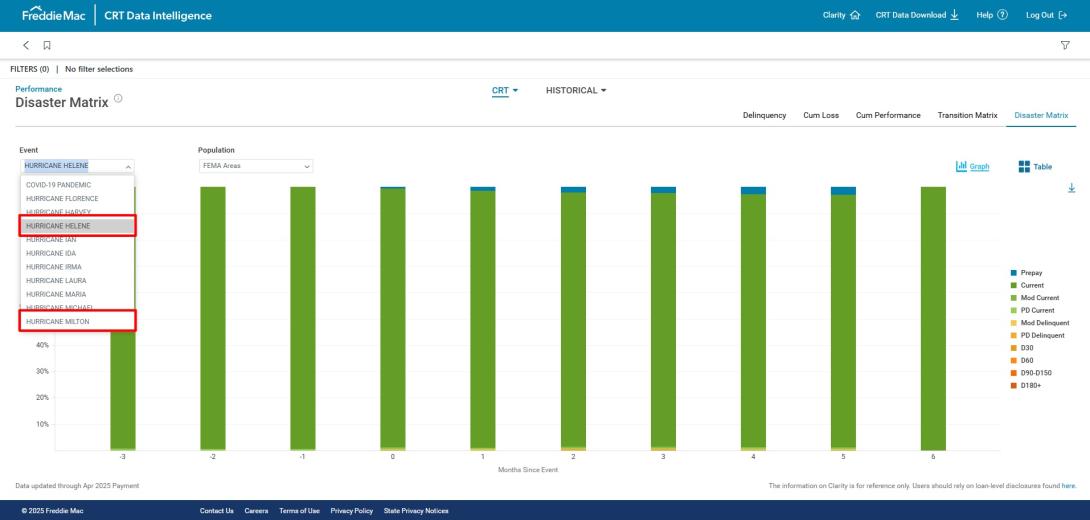
CRT Disaster Matrix – New Disaster Data Available
Data for two additional disasters is now available on the CRT Disaster Matrix. View how loans impacted by Hurricane Helene or Hurricane Milton have performed since the FEMA-declared event start date.