
October 2026 Clarity Updates
Explore the Latest Release
Our new Refinance Transition Report dashboard provides an interactive view of mortgage product transitions between existing Freddie Mac-owned mortgages that paid off and newly funded Freddie Mac refinance mortgages secured by the same properties.
The dashboard allows users to examine the mortgage product that borrowers held before refinancing, and the product selected for the new refinance mortgage. Results are presented by transition period and show the percentage of refinance transition volume associated with each Original Product and Refinanced Product combination.
Key Highlights
- Analyze transitions from existing mortgage products into newly funded refinance products.
- Compare refinance product selections across different Original Products.
- Examine how refinance transition patterns change over time.
- Dynamically filter results by Original Product, Refinanced Product, Year and Month.
- View transition percentages in either Graph or Heat Map format.
Download the data associated with the selected dashboard view.
Understanding the Graph View
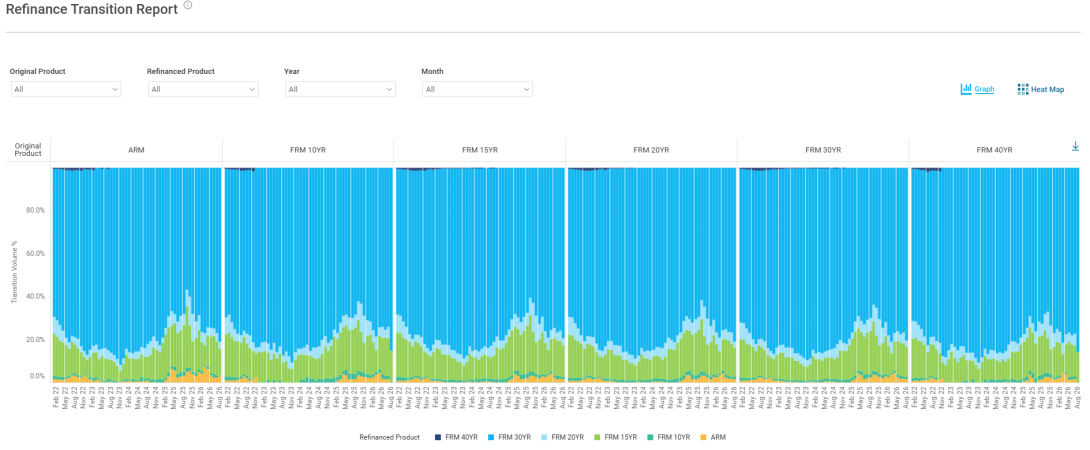
The Graph View consists of 100% stacked bar charts organized by Original Product. Original Product refers to the mortgage product associated with the existing Freddie Mac-owned loan that was paid off through refinancing. Refinanced Product refers to the mortgage product associated with the newly funded Freddie Mac refinance loan secured by the same property.
Each panel represents a different Original Product, such as an adjustable-rate mortgage or a fixed-rate mortgage with a specified term. Within each panel, each vertical bar shows how the applicable transition volume was distributed among the available Refinanced Products during that period.
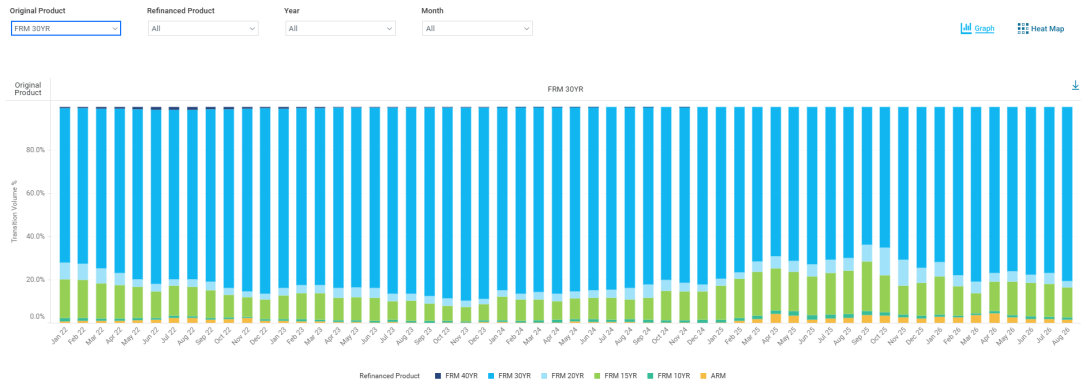
The full height of each bar represents 100% of the applicable transition volume. Each colored section represents the percentage of transition volume associated with a specific Refinanced Product, as identified in the legend.
For example, within the FRM 30YR panel, the FRM 30YR section represents the share of transition volume in which an existing 30-year fixed-rate mortgage was replaced by a new 30-year fixed-rate mortgage. The FRM 15YR section represents the share in which an existing 30-year fixed-rate mortgage transitioned into a new 15-year fixed-rate mortgage.
Explore Transitions Using the Heat Map
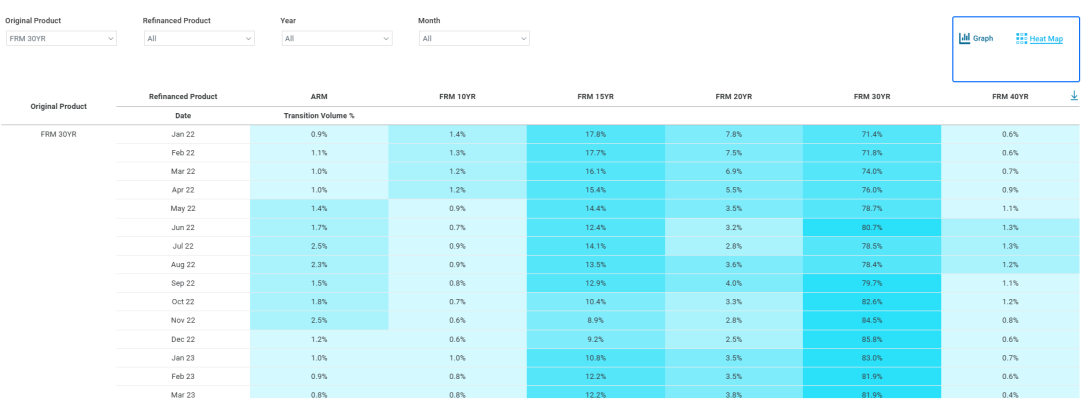
The dashboard also features a Heat Map View, which presents the refinance product transitions in a grid-based format. This view allows users to compare Original Product and Refinanced Product combinations and identify larger or smaller transition percentages through differences in cell shading.
Users may switch between views or download the data by selecting the download icon. The selected filters remain applied when switching between views, and downloaded results reflect the filters applied at the time of export.
Explore the new Refinance Transition Report dashboard in Clarity to better understand how Freddie Mac refinance volume transitions across mortgage products over time.