April 2025 Clarity Updates
The latest Clarity Data Intelligence®(Clarity) updates went live this past weekend to improve your Credit Risk Transfer (CRT) and Mortgage-Backed Securities (MBS) experience.
Here’s what’s new:
CRT Updates
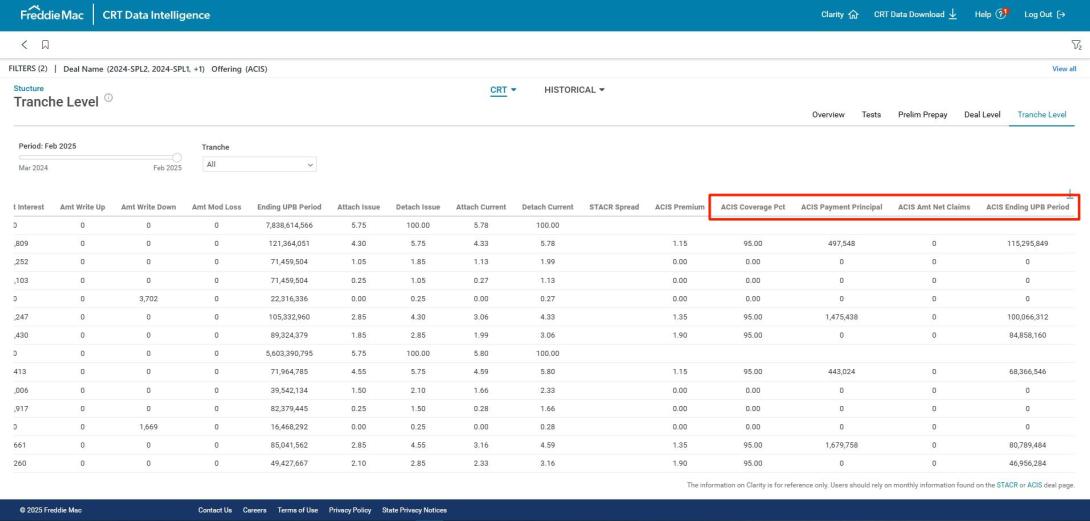
New ACIS® Columns on CRT Structure Dashboard
The Structure Tranche Level dashboard now features four new columns:
- ACIS Coverage Pct
- ACIS Payment Principal
- ACIS Amt Net Claims
- ACIS Ending UPB Period
Use these additional fields to view tranche-level payment and balance information for ACIS offerings by payment date.
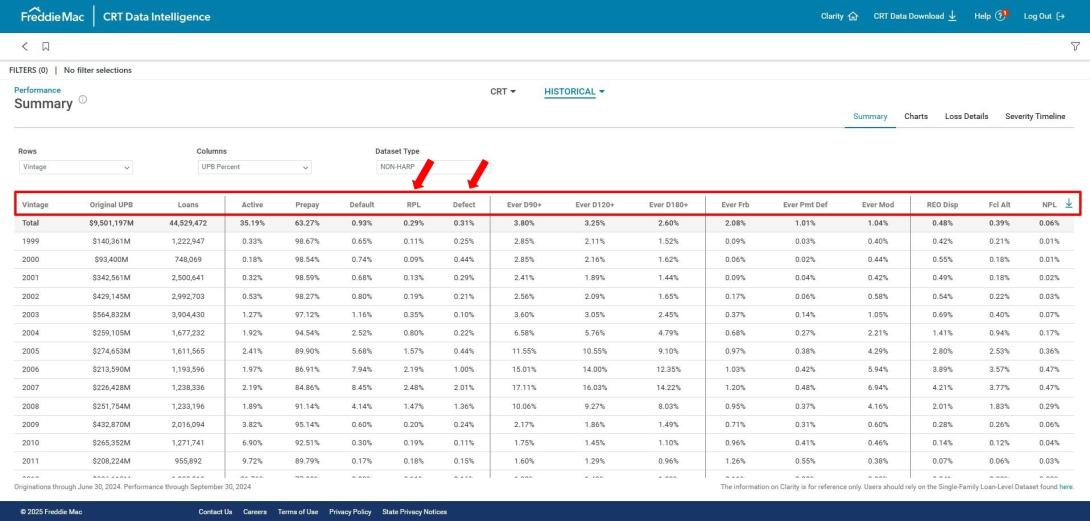
Enhanced Historical Dashboards – New Columns & Filter
We’ve revamped the Historical Performance Summary dashboard and have reordered and renamed columns to best display historical performance information of loans in the Single-Family Loan Level Dataset (SFLLD).
The dashboard also now features two new columns:
- RPL
- Defect
Use these columns to view the original UPB of the selected cohort where loans are part of a reperforming loan (RPL) securitization or that were identified as defective.
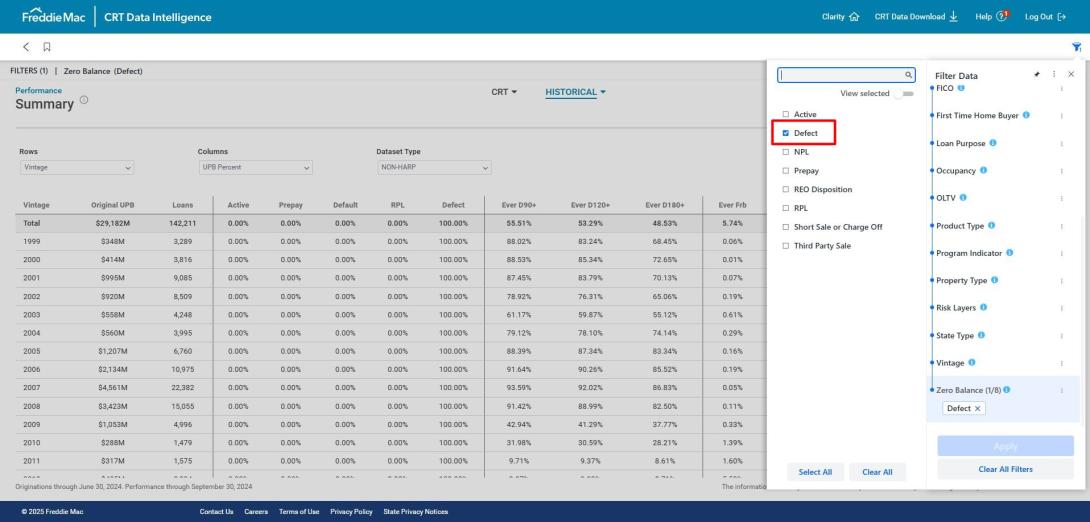
In addition, ‘Defect’ has been added to the Zero Balance Global Filter for all historical dashboards. For easier analysis, use this filter to restrict your view of the dashboards to see origination characteristics or performance data for only defective loans.
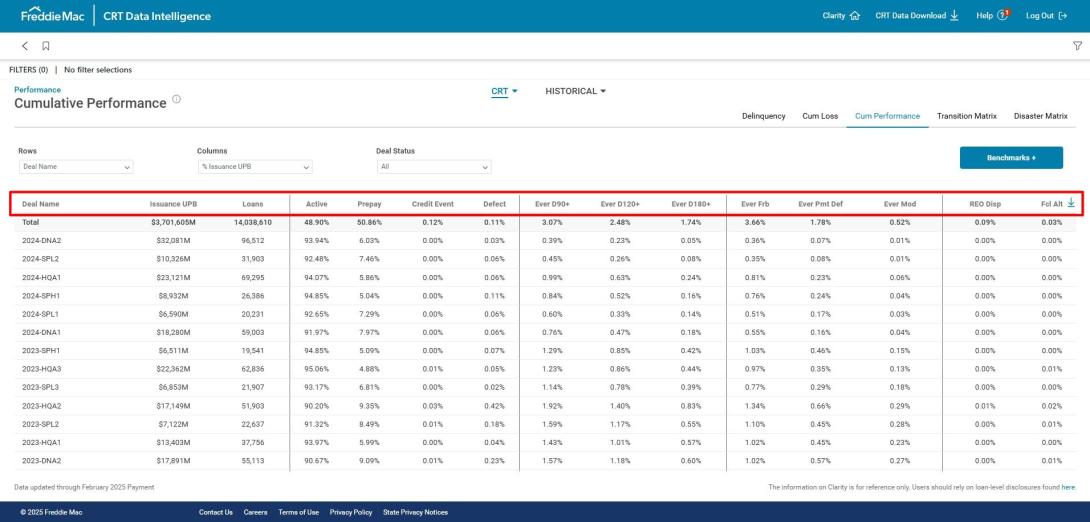
Redesigned CRT Performance Dashboard
Similar to the Historical Performance dashboard, columns on the CRT Cumulative Performance dashboard have been reordered and renamed to best display performance information of loans in CRT transactions. The underlying data displayed on the dashboard remains the same.
MBS Updates
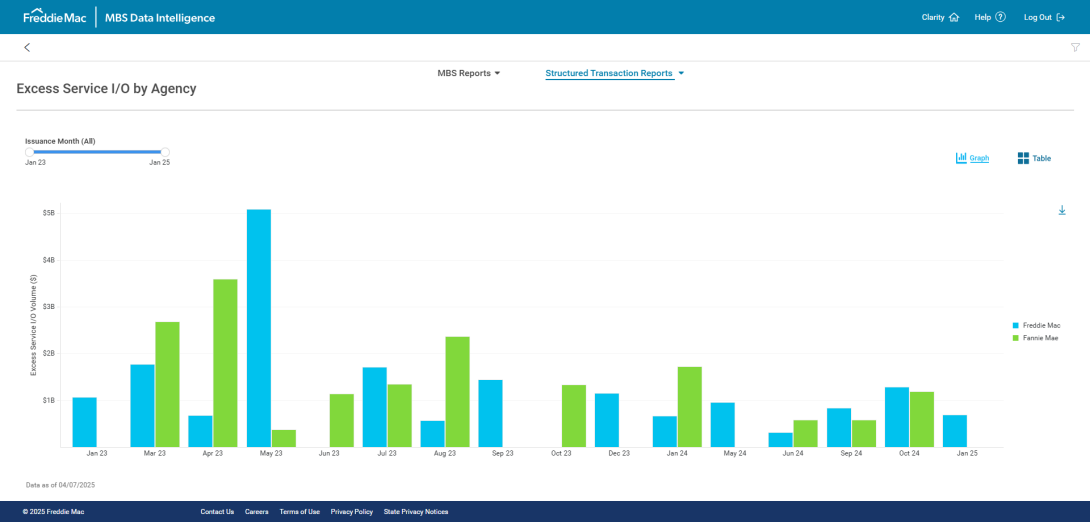
New MBS Excess Service Interest Only Dashboard
We’ve added a new Excess Service Interest Only (XSIO) by Agency dashboard under the MBS Structured Transaction Reports. The dashboard shows the monthly issuance volume of excess servicing fee transactions from each of the government-sponsored enterprises (GSEs), Freddie Mac (FRE) and Fannie Mae (FNM). This may provide a view into the overall excess servicing interest only bond supply for each GSE, relative market weights and other trends in the GSEs’ issuance.