September 2024 Clarity Updates
The latest Clarity Data Intelligence® (Clarity) updates went live last week. The changes include a new Clarity URL and enhancements to the Credit Risk Transfer (CRT) Historical Performance Charts (formerly named ‘Performance Triangle’).
Check out what’s new:
New Clarity URL
On September 27, the URL changed for logging into your Clarity account. Here’s what you need to know:
- If you access Clarity from our landing page, you will not be impacted, and no action is required.
- If you have bookmarked the dashboards, please update your bookmark to the new Clarity URL after logging in to maintain access to CRT and MBS dashboards.
CRT Updates
Change to Monthly Periods on Historical Performance Charts
The Historical Performance Charts dashboard (formerly Performance Triangle) has transitioned from yearly periods to monthly periods to provide a more granular view into the performance of loans in the Single-Family Loan-Level Dataset (SFLLD).
In addition, with the new ‘Period’ slider, you can modify your view of performance data to specified periods, making it easier to analyze loan performance during a certain period range. For example, you could now look at early delinquencies by vintage by adjusting the period slider to the first 12 or 24 months of performance.
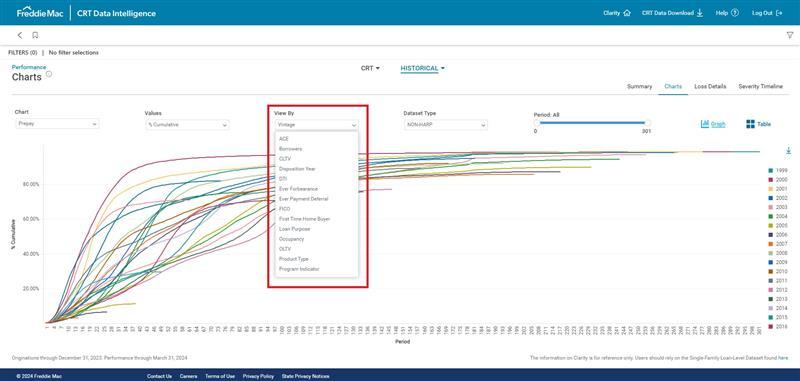
New ‘View By’ Drop-down on Historical Performance Charts
The Historical Performance Charts now feature a ‘View By’ drop-down that allows you to group data on the dashboard based on various loan-level attributes.
The historical performance data can now be viewed by:
- ACE
- Number of Borrowers
- CLTV
- Disposition Year
- DTI
- Ever Forbearance
- Ever Payment Deferral
- FICO
- First-time Homebuyer
- Loan Purpose
- Occupancy Status
- OLTV
- Product Type
- Program Indicator
- Property Type
- Risk Layers
- State Type
- Vintage
- No Grouping
With this new functionality, you can now easily compare how these attributes have influenced delinquency, prepays and defaults over time.


