Freddie Mac Introduces a New Prepayment Dashboard in Clarity
On September 11, Freddie Mac introduced the Prepayment Heatmap dashboard in Clarity Data Intelligence® (Clarity) to help you visualize the month-over-month changes in specific cohort-level prepayment rates for our mortgage-backed securities at any given point during each month. This will give you a clearer understanding of mortgage borrowers’ conditions and how mortgage-based products perform.
You’ll be able to monitor voluntary payoff activity with each weekly data refresh prior to the release of the upcoming factor date. Additionally, historical data from 2019 will be available.
How do I Find the Dashboard?
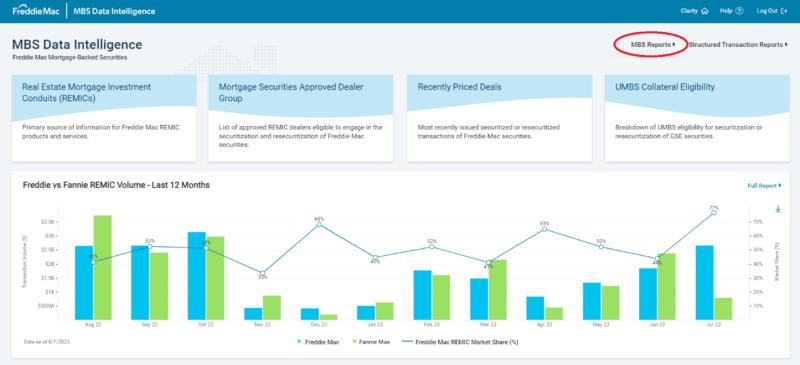
After you log into Clarity and select MBS Data Intelligence, you’ll click on MBS Reports on the top right of the screen.
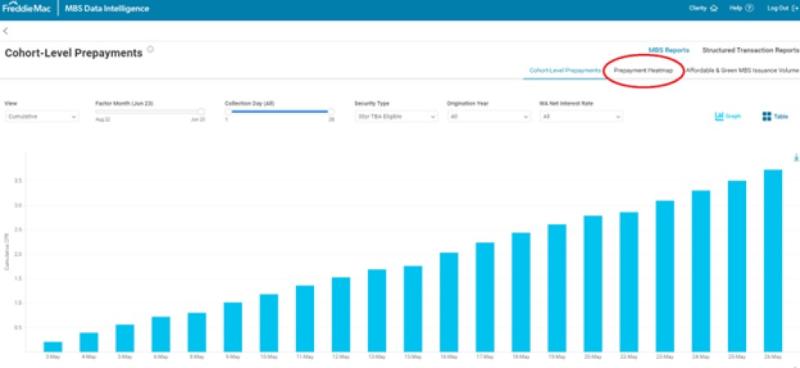
Once you click on MBS Reports, you’ll be given the option to select Prepayment Heatmap as one of the available dashboards.
The Heatmap Interface
After selecting Prepayment Heatmap, you’ll see a side-by-side grid with one red and green-shaded side, and the other blue-shaded. The red/green chart shows cumulative month-over-month voluntary constant prepayment rate (CPR) changes for specific cohorts, while the right blue chart illustrates total unpaid principal balance (UPB) for those same cohorts.
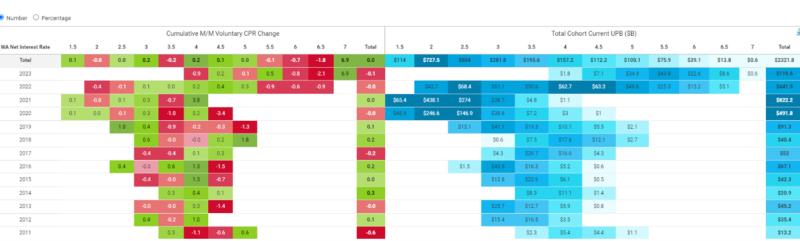
Data within the report will be updated every Wednesday at 4:30 P.M., showing the full voluntary payoff activity up until the end of the previous business week (the previous Friday), which allows you to monitor the latest prepayment trends prior to monthly factor releases.
Looking for more information about the Prepayment Heatmap? MBS’s Clarity user guide has detailed information about how to use the new dashboard and its enhancements.
For information on the data underlying the Prepayment Heatmap, see our Daily Prepayment Report webpage.
Have questions that need answering? Contact [email protected].