December 2, 2021 Enhancements
Deal Dashboard Enhancements
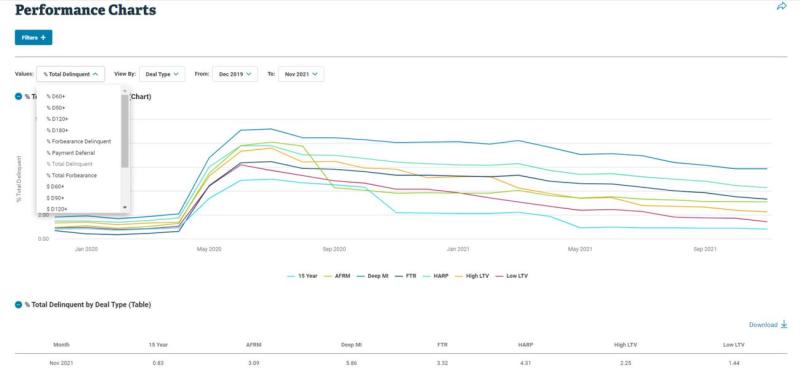
New Performance Charts Dashboard
Track CRT deal performance over the prior 24 months. Use the Values dropdown to organize data by delinquent statuses (D60+, D90+, D120+, D180+, Total), Total Forbearance, Forbearance Delinquent and Payment Deferral in either percentages or dollars. The View By dropdown offers grouping into specific cohorts. A chart summarizes the desired data by month over the past six months with table data below.

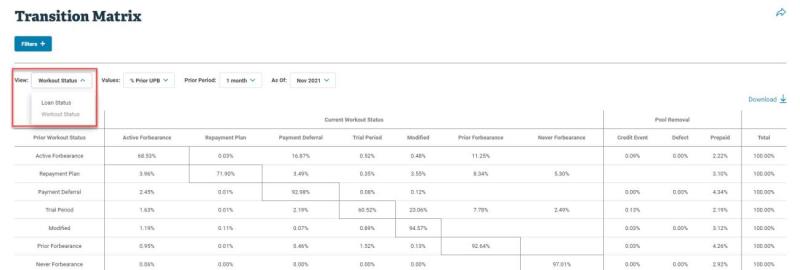
New View in Transition Matrix Dashboard
Choose Workout Status under View to see how loans included in CRT reference pools transition through seven workout statuses, as well as the population of loans removed from references pools due to credit events.

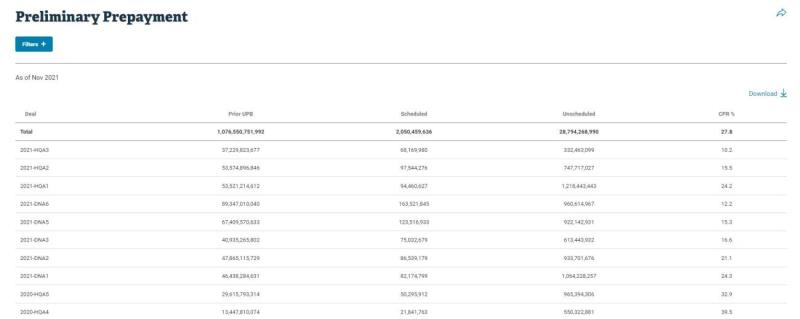
Preliminary Prepayment Data Now in Deal Dashboard
View the preliminary conditional prepayment rate (CPR) by deal for the most recent month (available on the fifth business day of the month) to get an early view into prepayment activity across CRT deals for the month.

New Deal Dashboard Filters
Use the Loan Status filter on any deal dashboard to view aggregated data based on loan payment status.
Apply the MI Type filter to any deal dashboard to view loan cohorts based on type of mortgage insurance and the MI Cancel filter to see cancellation status.

Historical Dashboard Enhancements
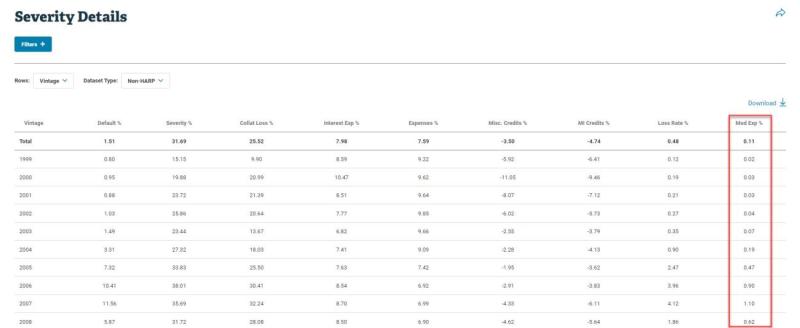
Modification Expense Added to Severity Details Dashboard
View the percentage of loan modification expense by vintage or disposition year or across debt-to-income (DTI), FICO, original loan-to-value (OLTV) or combined loan-to-value (CLTV) ranges. Note: Percentages equal the Rows selection divided by the default UPB.

Additional Historical Dashboard Filters
Use the ACE and Home Possible filters on any historical dashboard to view aggregated data based on these specific loan types, similar to deal dashboards.

